Bezier curve, defined by 4 control points.
bezier_curve(
  p1 = c(0, 0, 0),
  p2 = c(-1, 0.33, 0),
  p3 = c(1, 0.66, 0),
  p4 = c(0, 1, 0),
  x = 0,
  y = 0,
  z = 0,
  width = 0.1,
  width_end = NA,
  u_min = 0,
  u_max = 1,
  type = "cylinder",
  normal = c(0, 0, -1),
  normal_end = NA,
  material = diffuse(),
  angle = c(0, 0, 0),
  order_rotation = c(1, 2, 3),
  flipped = FALSE,
  scale = c(1, 1, 1)
)
Arguments
- p1
Default `c(0,0,0)`. First control point. Can also be a list of 4 length-3 numeric vectors or 4x3 matrix/data.frame specifying the x/y/z control points.
- p2
Default `c(-1,0.33,0)`. Second control point.
- p3
Default `c(1,0.66,0)`. Third control point.
- p4
Default `c(0,1,0)`. Fourth control point.
- x
Default `0`. x-coordinate offset for the curve.
- y
Default `0`. y-coordinate offset for the curve.
- z
Default `0`. z-coordinate offset for the curve.
- width
Default `0.1`. Curve width.
- width_end
Default `NA`. Width at end of path. Same as `width`, unless specified.
- u_min
Default `0`. Minimum parametric coordinate for the curve.
- u_max
Default `1`. Maximum parametric coordinate for the curve.
- type
Default `cylinder`. Other options are `flat` and `ribbon`.
- normal
Default `c(0,0,-1)`. Orientation surface normal for the start of ribbon curves.
- normal_end
Default `NA`. Orientation surface normal for the start of ribbon curves. If not specified, same as `normal`.
- material
Default
diffuse.The material, called from one of the material functionsdiffuse,metal, ordielectric.- angle
Default `c(0, 0, 0)`. Angle of rotation around the x, y, and z axes, applied in the order specified in `order_rotation`.
- order_rotation
Default `c(1, 2, 3)`. The order to apply the rotations, referring to "x", "y", and "z".
- flipped
Default `FALSE`. Whether to flip the normals.
- scale
Default `c(1, 1, 1)`. Scale transformation in the x, y, and z directions. If this is a single value, number, the object will be scaled uniformly. Note: emissive objects may not currently function correctly when scaled.
Value
Single row of a tibble describing the cube in the scene.
Examples
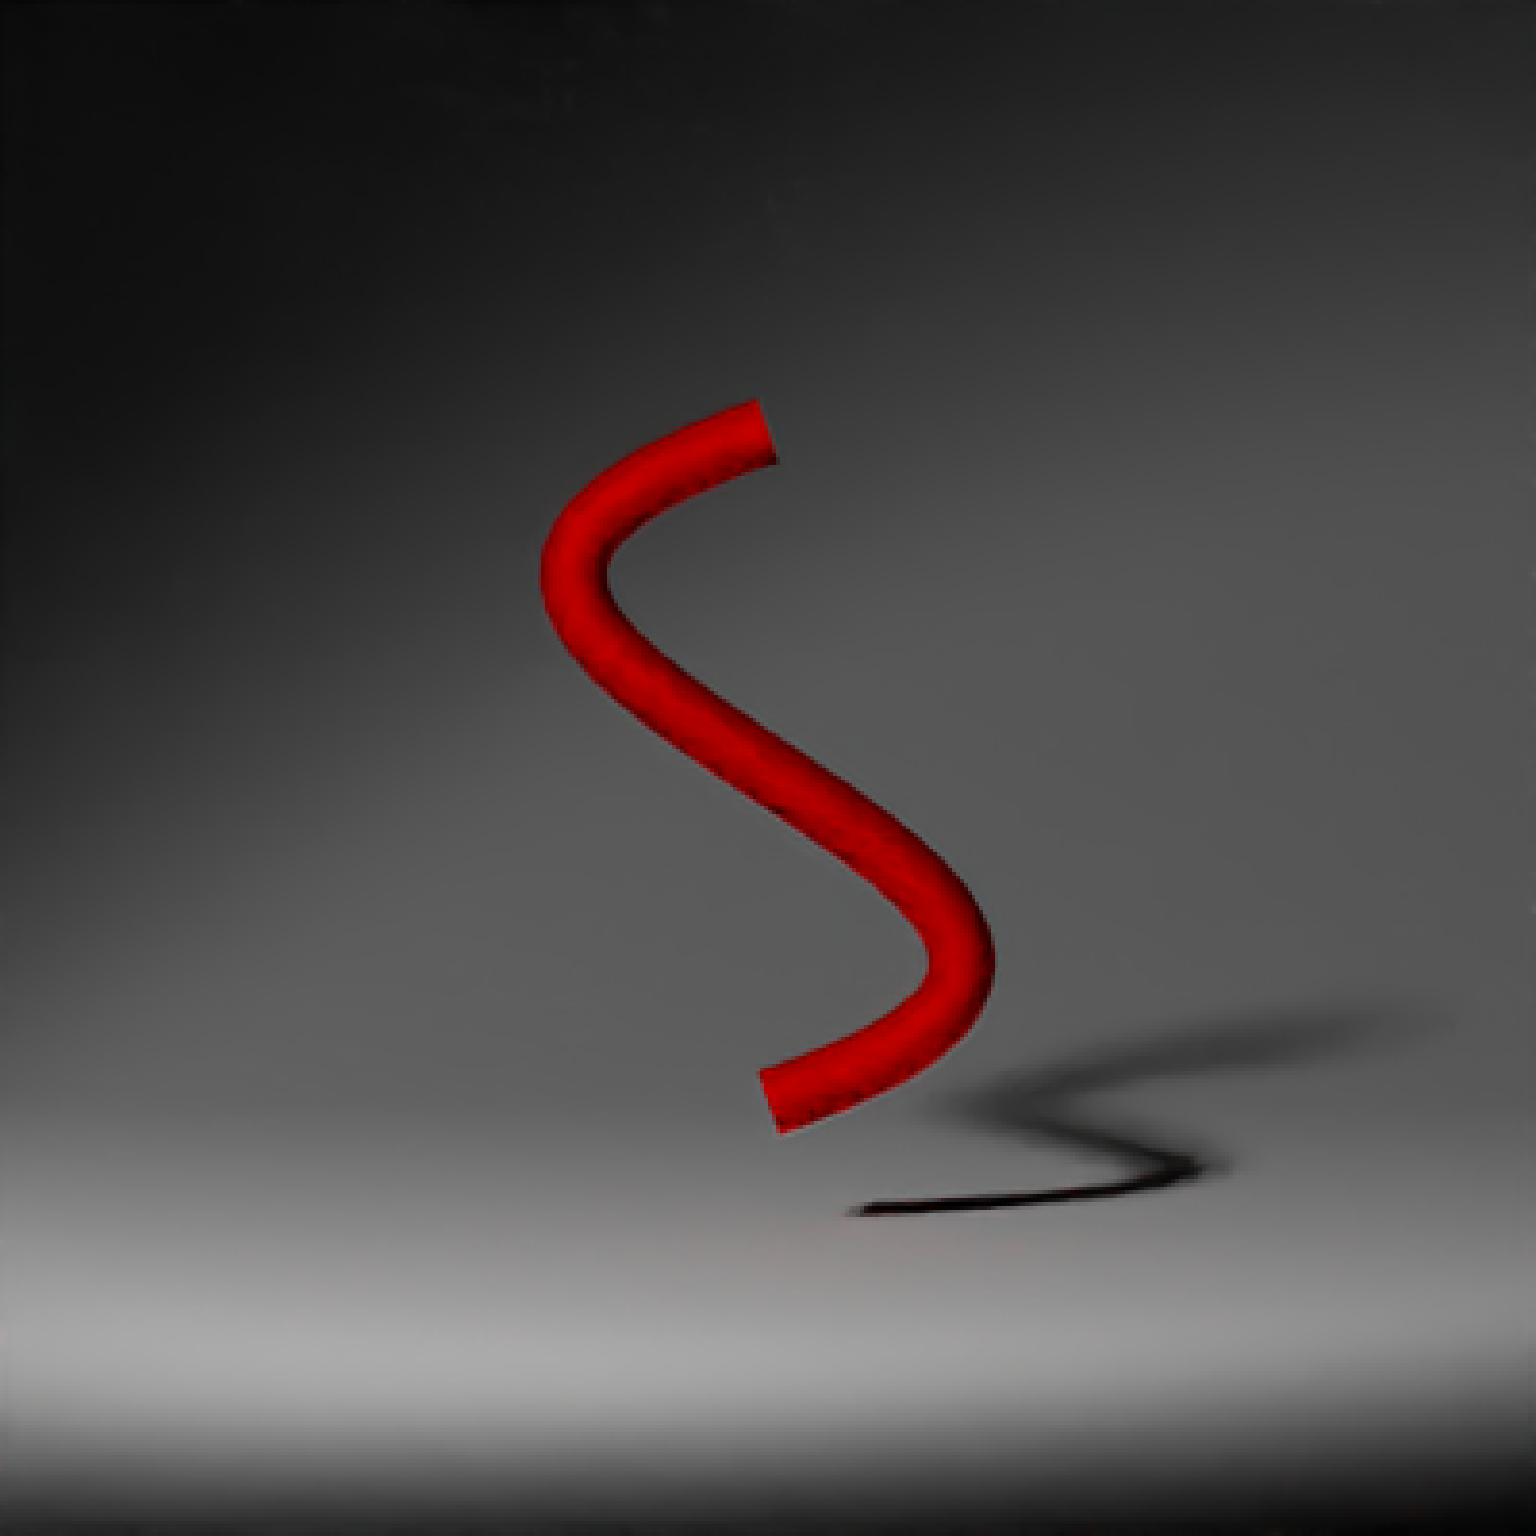
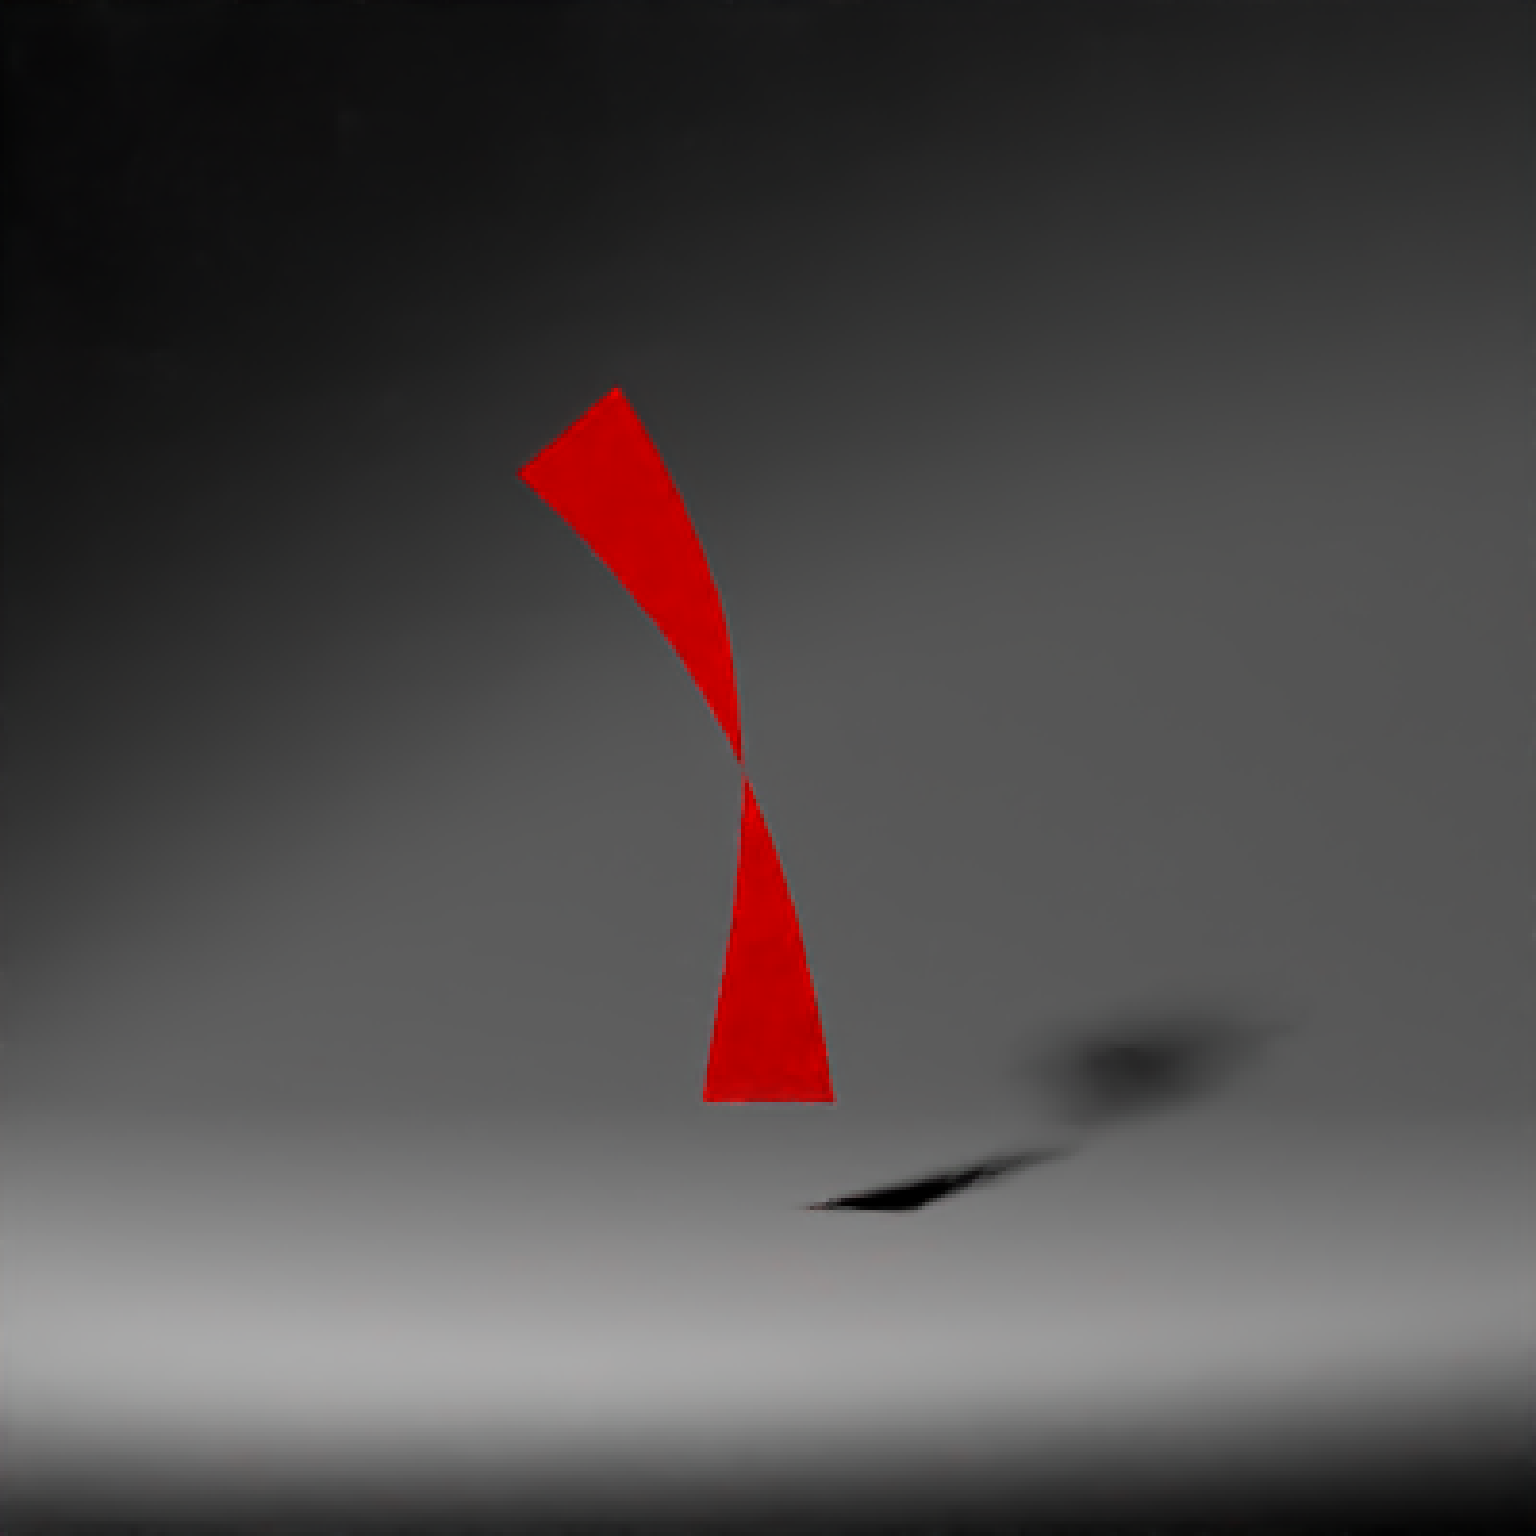
#Generate the default curve:
generate_studio(depth=-0.2) |>
add_object(bezier_curve(material=diffuse(color="red"))) |>
add_object(sphere(y=3,z=-5,x=2,radius=0.3,
material=light(intensity=200, spotlight_focus = c(0,0.5,0)))) |>
render_scene(clamp_value = 10, lookat = c(0,0.5,0), fov=13,
samples=16)
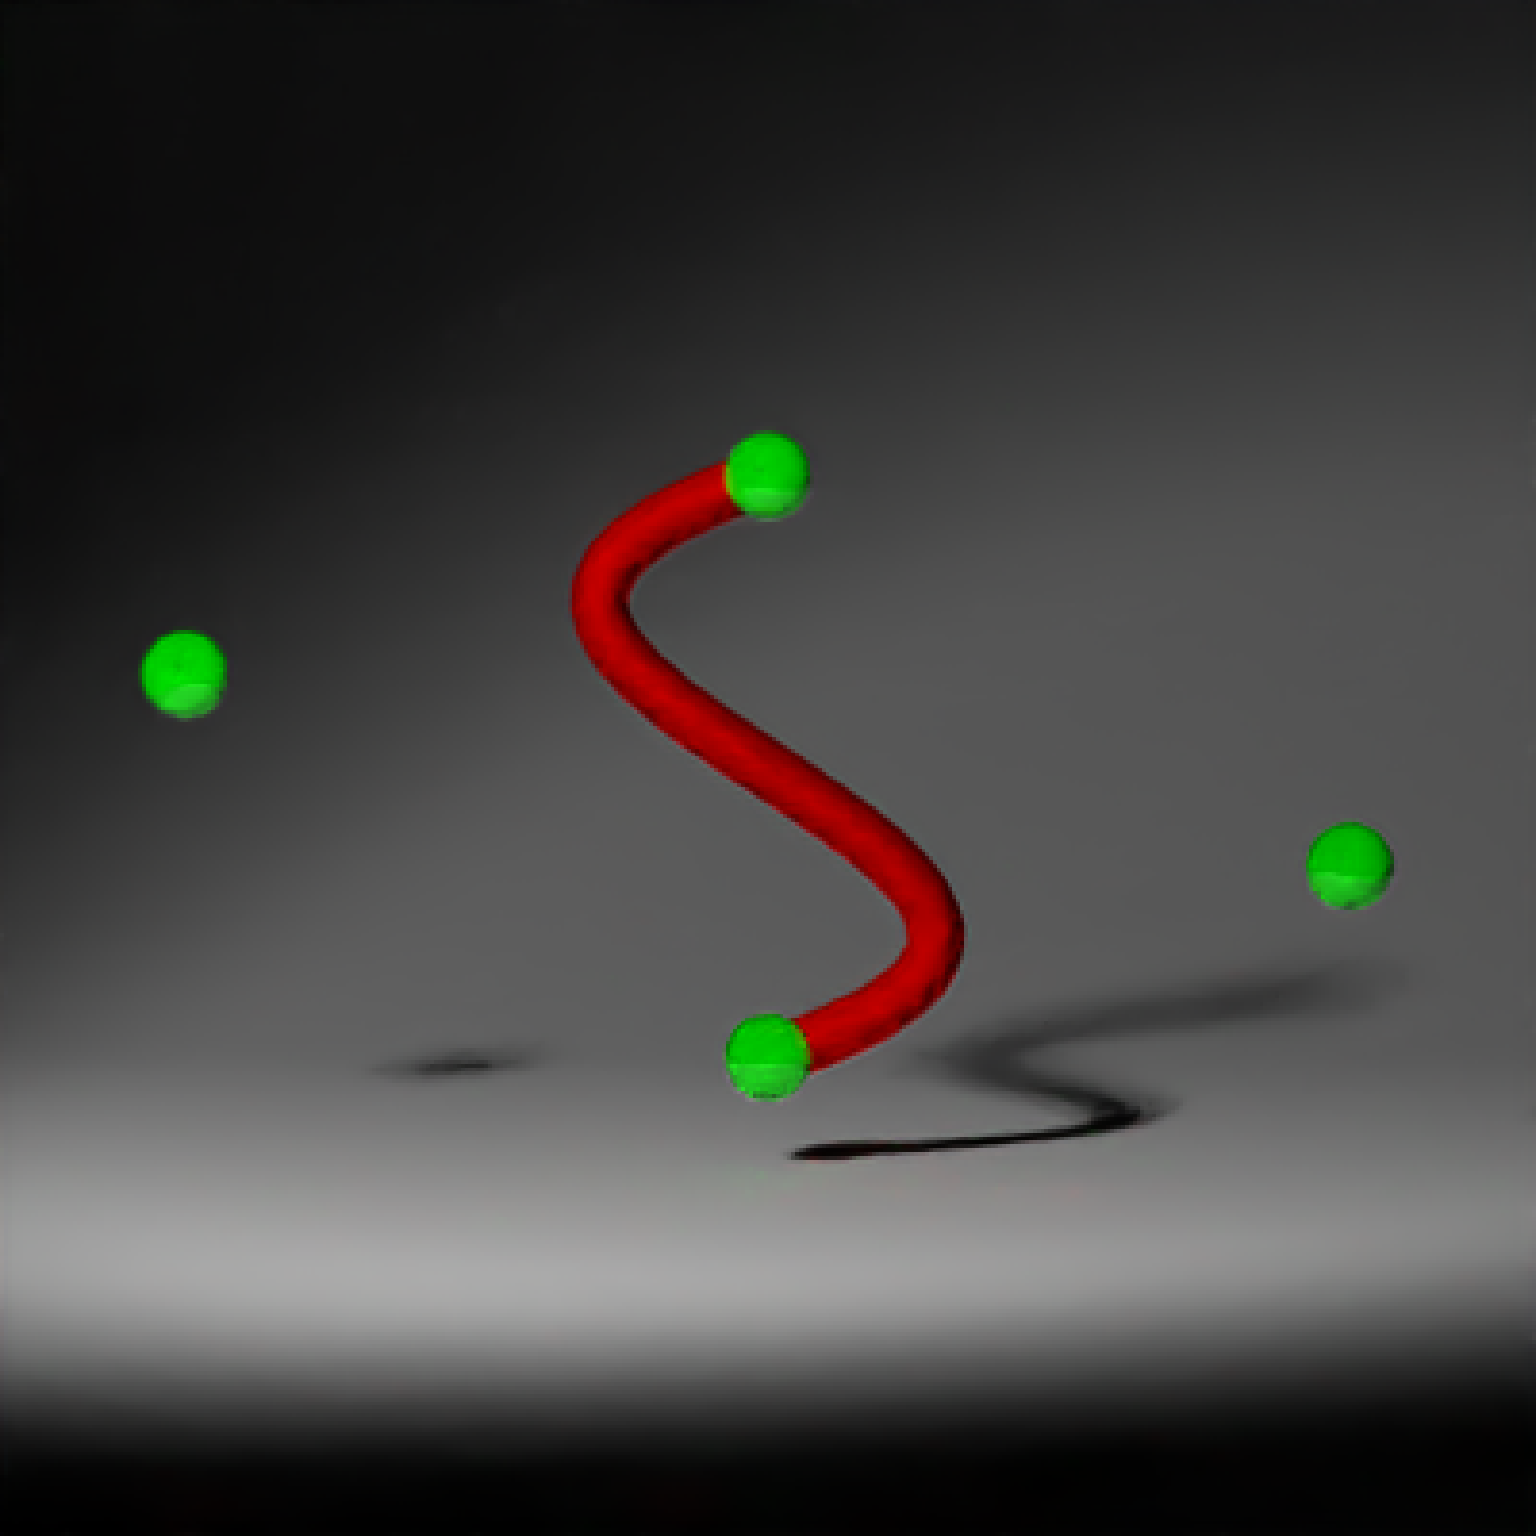
 #Change the control points to change the direction of the curve. Here, we place spheres
#at the control point locations.
generate_studio(depth=-0.2) |>
add_object(bezier_curve(material=diffuse(color="red"))) |>
add_object(sphere(radius=0.075,material=glossy(color="green"))) |>
add_object(sphere(radius=0.075,x=-1,y=0.33,material=glossy(color="green"))) |>
add_object(sphere(radius=0.075,x=1,y=0.66,material=glossy(color="green"))) |>
add_object(sphere(radius=0.075,y=1,material=glossy(color="green"))) |>
add_object(sphere(y=3,z=-5,x=2,radius=0.3,
material=light(intensity=200, spotlight_focus = c(0,0.5,0)))) |>
render_scene(clamp_value = 10, lookat = c(0,0.5,0), fov=15,
samples=16)
#Change the control points to change the direction of the curve. Here, we place spheres
#at the control point locations.
generate_studio(depth=-0.2) |>
add_object(bezier_curve(material=diffuse(color="red"))) |>
add_object(sphere(radius=0.075,material=glossy(color="green"))) |>
add_object(sphere(radius=0.075,x=-1,y=0.33,material=glossy(color="green"))) |>
add_object(sphere(radius=0.075,x=1,y=0.66,material=glossy(color="green"))) |>
add_object(sphere(radius=0.075,y=1,material=glossy(color="green"))) |>
add_object(sphere(y=3,z=-5,x=2,radius=0.3,
material=light(intensity=200, spotlight_focus = c(0,0.5,0)))) |>
render_scene(clamp_value = 10, lookat = c(0,0.5,0), fov=15,
samples=16)
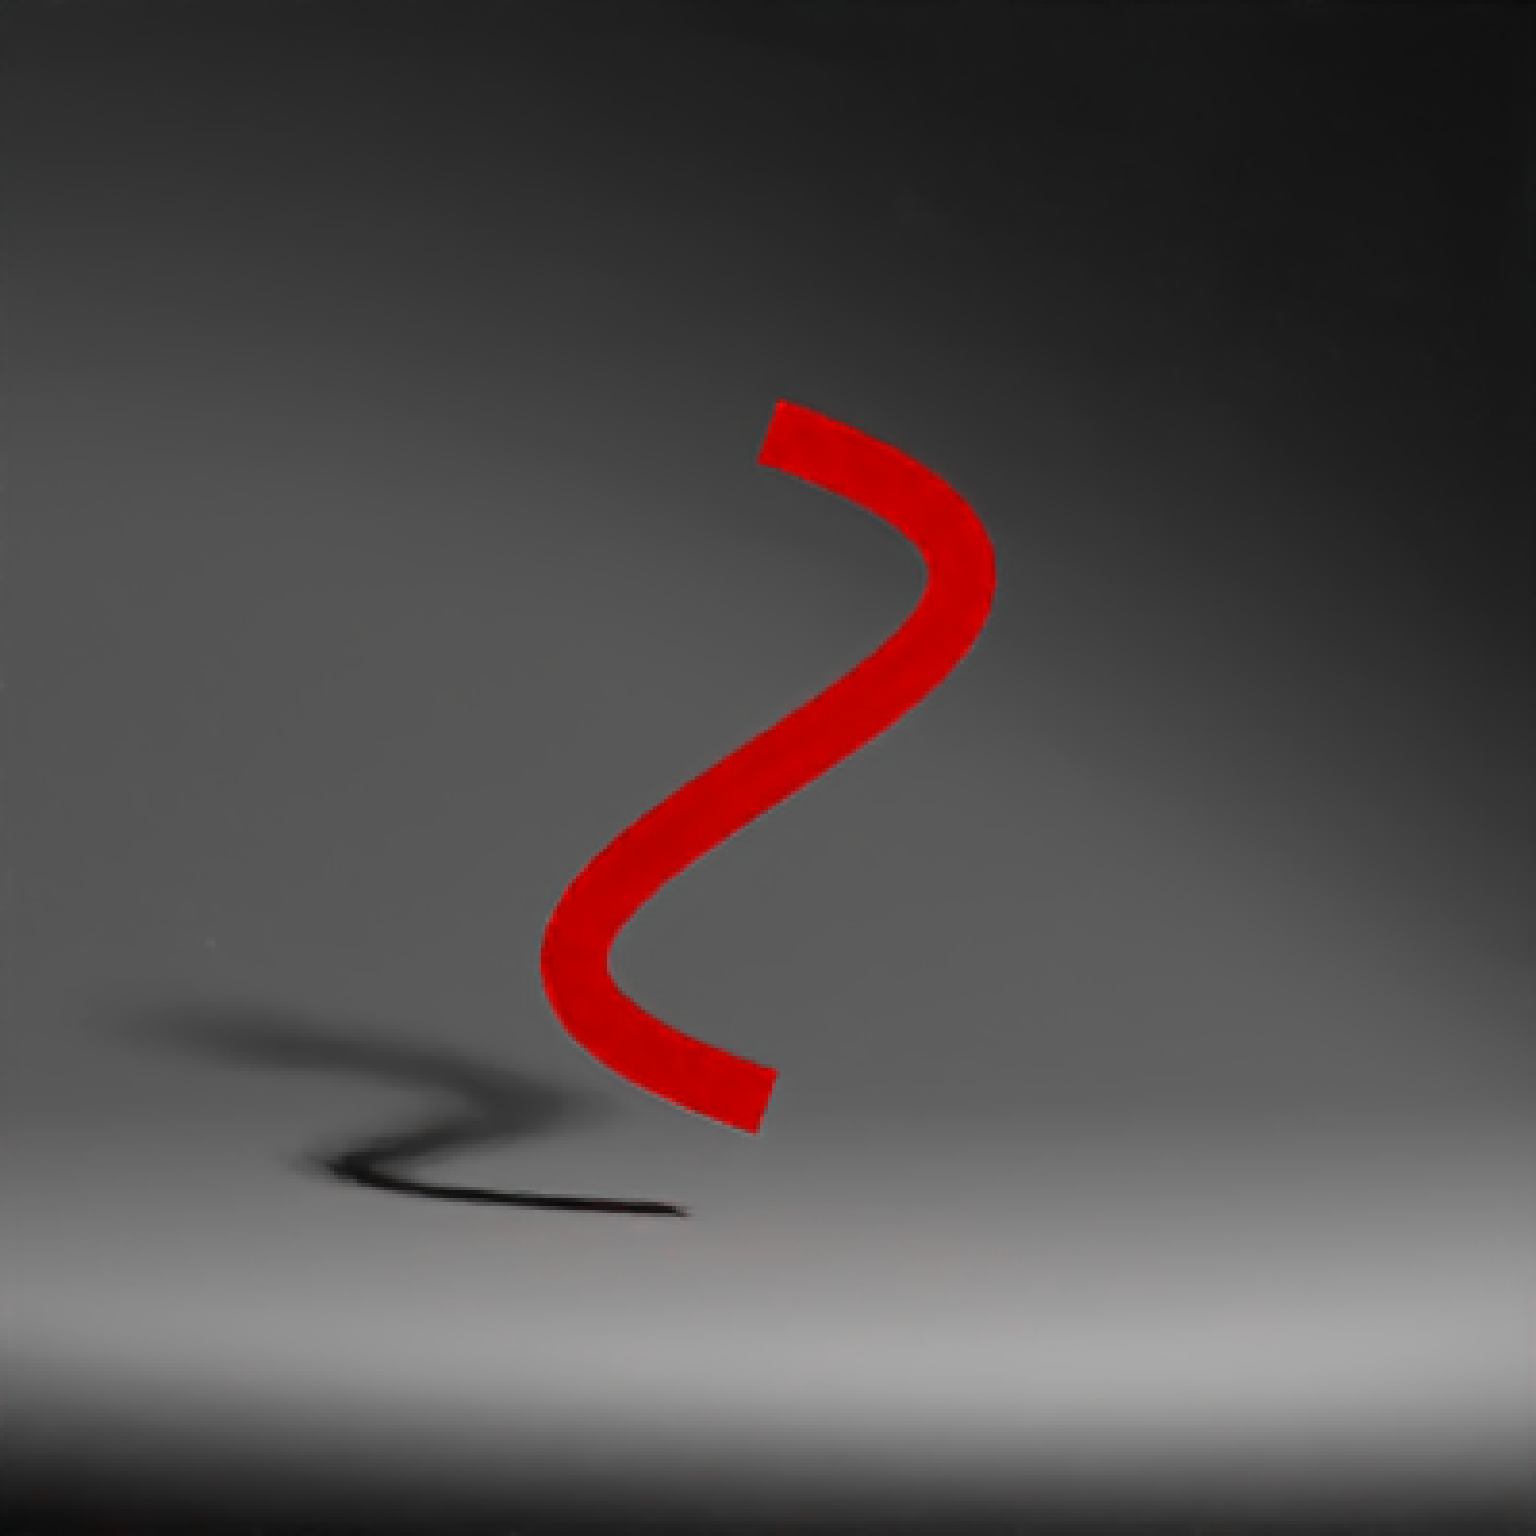
 #We can make the curve flat (always facing the camera) by setting the type to `flat`
generate_studio(depth=-0.2) |>
add_object(bezier_curve(type="flat", material=glossy(color="red"))) |>
add_object(sphere(y=3,z=-5,x=2,radius=0.3,
material=light(intensity=200, spotlight_focus = c(0,0.5,0)))) |>
render_scene(clamp_value = 10, lookat = c(0,0.5,0), fov=13,
samples=16)
#We can make the curve flat (always facing the camera) by setting the type to `flat`
generate_studio(depth=-0.2) |>
add_object(bezier_curve(type="flat", material=glossy(color="red"))) |>
add_object(sphere(y=3,z=-5,x=2,radius=0.3,
material=light(intensity=200, spotlight_focus = c(0,0.5,0)))) |>
render_scene(clamp_value = 10, lookat = c(0,0.5,0), fov=13,
samples=16)
 #We can also plot a ribbon, which is further specified by a start and end orientation with
#two surface normals.
generate_studio(depth=-0.2) |>
add_object(bezier_curve(type="ribbon", width=0.2,
p1 = c(0,0,0), p2 = c(0,0.33,0), p3 = c(0,0.66,0), p4 = c(0.3,1,0),
normal_end = c(0,0,1),
material=glossy(color="red"))) |>
add_object(sphere(y=3,z=-5,x=2,radius=0.3,
material=light(intensity=200, spotlight_focus = c(0,0.5,0)))) |>
render_scene(clamp_value = 10, lookat = c(0,0.5,0), fov=13,
samples=16)
#We can also plot a ribbon, which is further specified by a start and end orientation with
#two surface normals.
generate_studio(depth=-0.2) |>
add_object(bezier_curve(type="ribbon", width=0.2,
p1 = c(0,0,0), p2 = c(0,0.33,0), p3 = c(0,0.66,0), p4 = c(0.3,1,0),
normal_end = c(0,0,1),
material=glossy(color="red"))) |>
add_object(sphere(y=3,z=-5,x=2,radius=0.3,
material=light(intensity=200, spotlight_focus = c(0,0.5,0)))) |>
render_scene(clamp_value = 10, lookat = c(0,0.5,0), fov=13,
samples=16)
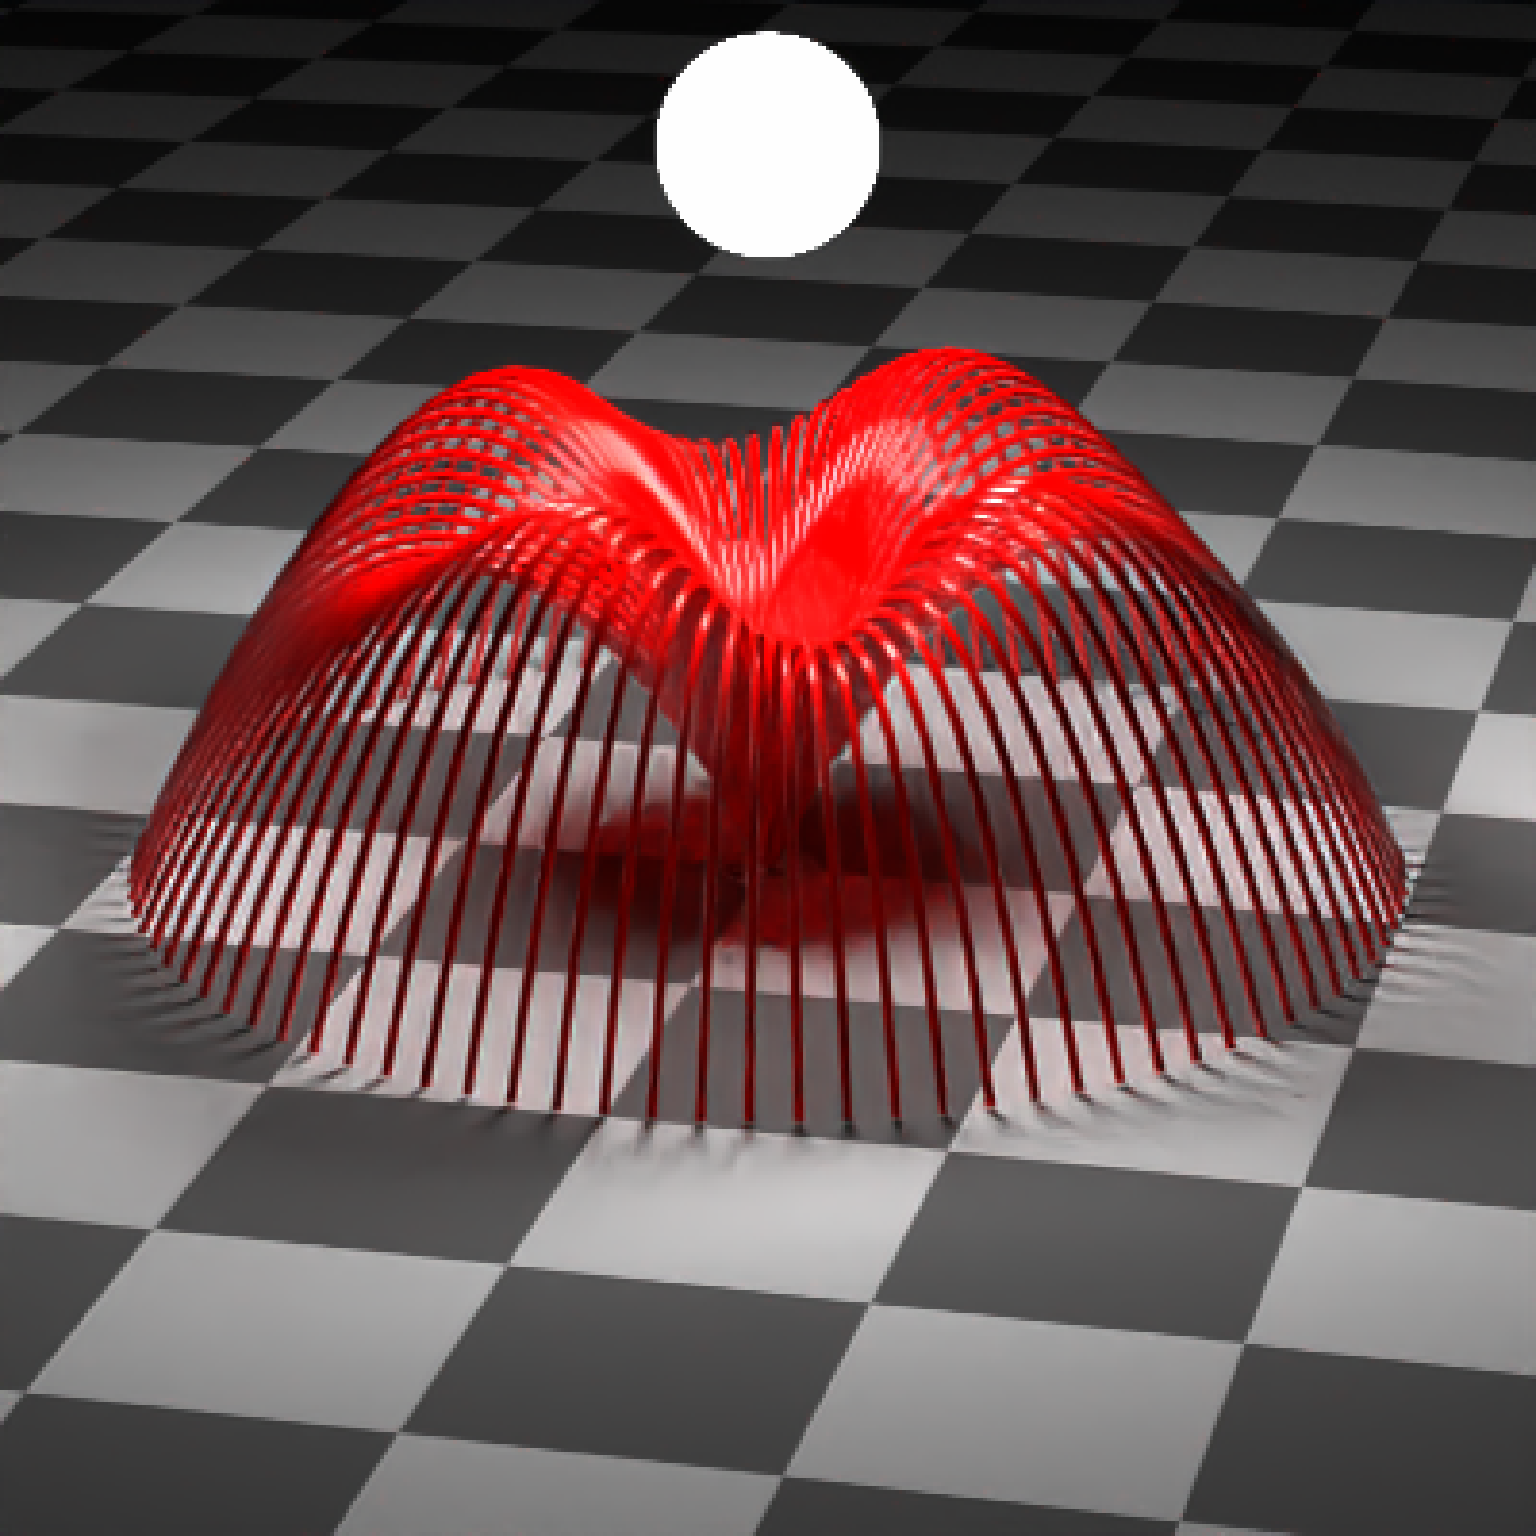
 #Create a single curve and copy and rotate it around the y-axis to create a wavy fountain effect:
scene_curves = list()
for(i in 1:90) {
scene_curves[[i]] = bezier_curve(p1 = c(0,0,0),p2 = c(0,5-sinpi(i*16/180),2),
p3 = c(0,5-0.5 * sinpi(i*16/180),4),p4 = c(0,0,6),
angle=c(0,i*4,0), type="cylinder",
width = 0.1, width_end =0.1,material=glossy(color="red"))
}
all_curves = do.call(rbind, scene_curves)
generate_ground(depth=0,material=diffuse(checkercolor="grey20")) |>
add_object(all_curves) |>
add_object(sphere(y=7,z=0,x=0,material=light(intensity=100))) |>
render_scene(lookfrom = c(12,20,50),samples=100,
lookat=c(0,1,0), fov=15, clamp_value = 10)
#Create a single curve and copy and rotate it around the y-axis to create a wavy fountain effect:
scene_curves = list()
for(i in 1:90) {
scene_curves[[i]] = bezier_curve(p1 = c(0,0,0),p2 = c(0,5-sinpi(i*16/180),2),
p3 = c(0,5-0.5 * sinpi(i*16/180),4),p4 = c(0,0,6),
angle=c(0,i*4,0), type="cylinder",
width = 0.1, width_end =0.1,material=glossy(color="red"))
}
all_curves = do.call(rbind, scene_curves)
generate_ground(depth=0,material=diffuse(checkercolor="grey20")) |>
add_object(all_curves) |>
add_object(sphere(y=7,z=0,x=0,material=light(intensity=100))) |>
render_scene(lookfrom = c(12,20,50),samples=100,
lookat=c(0,1,0), fov=15, clamp_value = 10)